Refrigerant PT Chart (Pressure Temperature)
Choose a refrigerant to see its pressure temperature chart, or convert a gauge pressure to saturation temperature.
A refrigerant PT chart is a table that lists the pressure at which a refrigerant boils or condenses at each temperature. This free calculator on the page does the same job for 11 refrigerants: pick a refrigerant, enter a temperature or a pressure, and it returns the matching value along with a full chart table. It runs in your browser, nothing is uploaded, and there is no sign-up.
It suits HVAC technicians, students and anyone checking an AC pt chart or HVAC pt chart reading. Refrigerants outside its list are not covered, including R-11, R-12, R-123, R-407A, R-422B, R-422D and CO2 (so no co2 pt chart is available here).
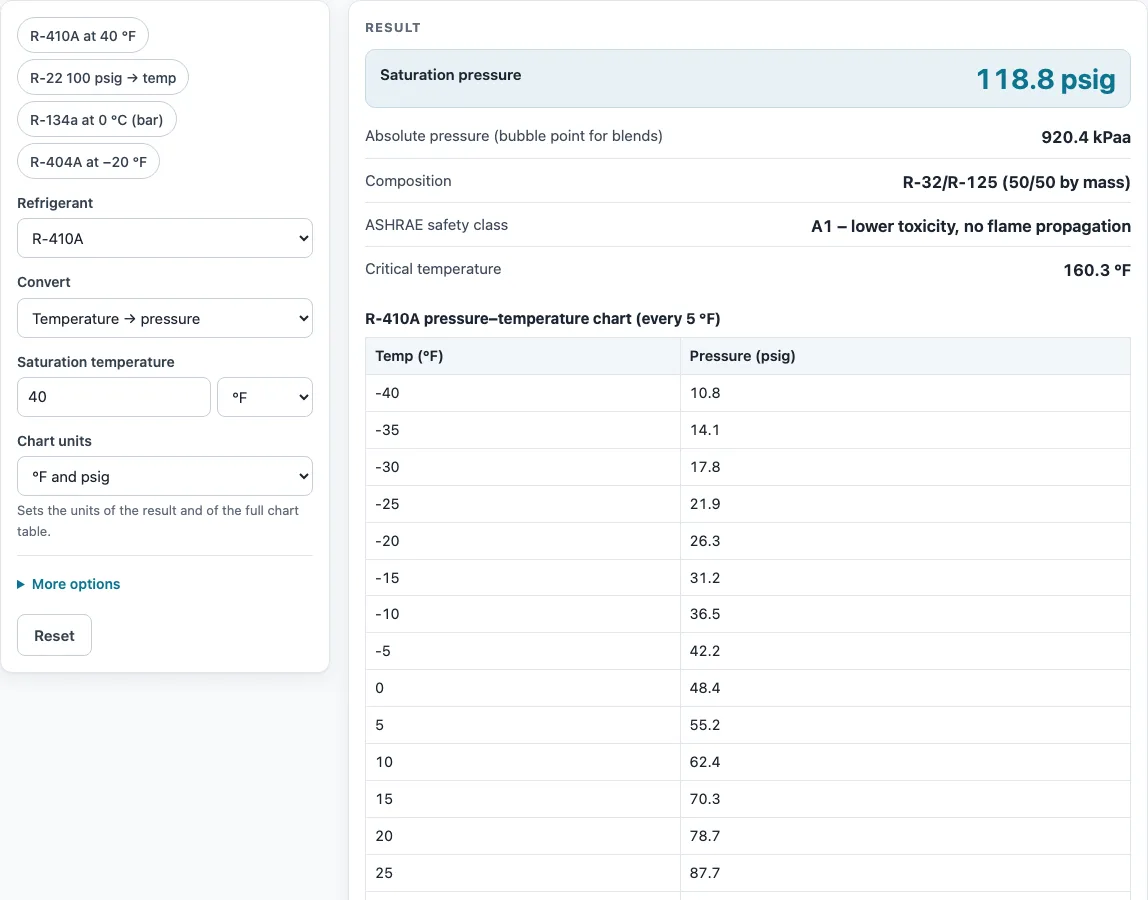
How to use the refrigerant PT chart
- Choose a refrigerant from the Refrigerant drop-down. For a blend such as R-407C, the result shows both a bubble point and a dew point column.
- Set Convert to Temperature → pressure or Pressure → temperature.
- Enter a value in Saturation temperature (°F or °C) if you are converting temperature to pressure. Otherwise, enter it in Gauge or absolute pressure, using psig, kPag or barg for a gauge reading, or psia, kPaa or bara for an absolute reading.
- Pick a Chart units option: °F and psig, °C and bar (gauge), or °C and kPa (gauge). This sets the units for the result and the chart table.
- Open More options. Set Chart table step to Auto, every 1, 2, 5 or 10 degrees. If you work above sea level, enter Altitude above sea level in ft or m. Leave it blank at sea level.
- Read the result rows. Only the rows that match your chosen mode appear. The pressure–temperature table is shown under the result.
- Open How it was calculated to see the formula and each step with your numbers.
Example buttons above the form load ready-made calculations, such as R-410A at 40 °F. Copy result copies the result lines with a link. Copy link stores every input in the page address, so the same calculation reopens later. Print / save as PDF outputs the inputs, results, steps and date. Reset restores the starting example.
How do you read a refrigerant PT chart?
A PT chart pairs each temperature with the saturation pressure of the refrigerant at that temperature, the pressure at which liquid and vapor exist together. To read it, find the temperature row and read across to the pressure column. To go the other way, find the pressure and read down to the matching temperature.
Technicians use the chart to turn a gauge reading into a saturation temperature. R-410A at 40 °F is 118.8 psig at sea level, so a gauge showing about 118 psig on R-410A corresponds to roughly 40 °F. The tool gives the same conversion: R-410A at 118 psig works out to 39.65 °F. Next, the technician measures the actual line temperature with a thermometer. The difference between the two gives superheat on the suction line or subcooling on the liquid line.
On the high side, the same logic applies. R-410A at 120 °F is 419.5 psig, so a condensing pressure near that value points to a condensing temperature near 120 °F.
What is the difference between bubble point and dew point on a PT chart?
The bubble point is where a liquid blend first starts to boil and form vapor bubbles. It appears in the liquid column. The dew point is where a vapor blend first starts to condense and form liquid. It appears in the vapor column.
For pure refrigerants, the two values are the same. Blends with temperature glide, such as R-407C, R-448A and R-454B, and to a lesser degree R-404A, have different values in each column. R-454B at 40 °F reads 113.2 psig as liquid and 107.5 psig as vapor, a gap of 5.7 psi.
Use the vapor (dew point) column for superheat and evaporator readings. Use the liquid (bubble point) column for subcooling and condenser readings. The tool shows a warning whenever you select a blend with temperature glide.
Sources
Data and methods used by this calculator (checked October 2026):
- CoolProp equations of state (saturation data)
- NIST Chemistry WebBook, thermophysical properties of fluids (pure refrigerants, checked within 0.05 %)
- Goodman, A1 vs. A2L pressure temperature chart, USA °F/psig (R-22, R-410A, R-32, R-454B)
- ASHRAE Standard 34 refrigerant designations and safety classes
Worked examples
| Input | Result |
|---|---|
| R-410A, 40 °F | 118.8 psig |
| R-410A, 120 °F | 419.5 psig |
| R-410A, 118 psig | 39.65 °F |
| R-410A, 5 °C | 8.349 barg |
Calculated by the tool above with these values.
Frequently asked questions
Is a PT chart in psig or psia?
Most PT charts are in psig, which is gauge pressure measured relative to the atmosphere. At sea level, atmospheric pressure is 14.696 psi, so psia = psig + 14.696. The tool also supports kPag, barg, MPag, kPaa and bara.
What does a PT chart tell you?
A PT chart tells you the saturation pressure of a refrigerant at a given temperature. Technicians use it to connect a gauge reading to a temperature and then compare that temperature with a measured line temperature to find superheat or subcooling.
Can I print a PT chart?
Yes. Use Print / save as PDF below the result. The printout includes your inputs, results, calculation steps and the date. Results may be used freely in quotes, proposals, reports and service records, with no attribution needed.
How accurate are the blend values?
Pure fluids agree with NIST data within 0.01 %. Blend values can differ from a manufacturer’s chart by 1–2 psi, so check against the manufacturer’s data when you need precise figures.
What if my gauge reads a negative number?
A negative gauge value means the pressure is below atmospheric, so the gauge is reading vacuum. The tool shows a warning when this happens. If you are above sea level, enter your altitude under More options so that gauge readings are interpreted correctly.
Related tools
- Superheat and subcooling calculator: use it after you have a saturation temperature and want the superheat or subcooling of a line.
- R-410A PT chart: use it when you work with R-410A and want that refrigerant’s own chart page.
- R-22 PT chart: use it for older systems that run on R-22.
- R-32 PT chart: use it for systems charged with R-32.
- R-454B PT chart: use it for systems using R-454B, a blend with temperature glide.
- R-134a PT chart: use it for R-134a systems, such as many refrigeration and automotive units.
- R-404A PT chart: use it for R-404A refrigeration systems.
- R-448A PT chart: use it for R-448A, a blend that needs the bubble and dew columns.
- All HVAC calculators: use it to find other tools for your HVAC work.