R-448A PT Chart (448A Pressure Temperature)
Look up R-448A liquid and vapor saturation pressures for a temperature, or the temperatures for a gauge reading.
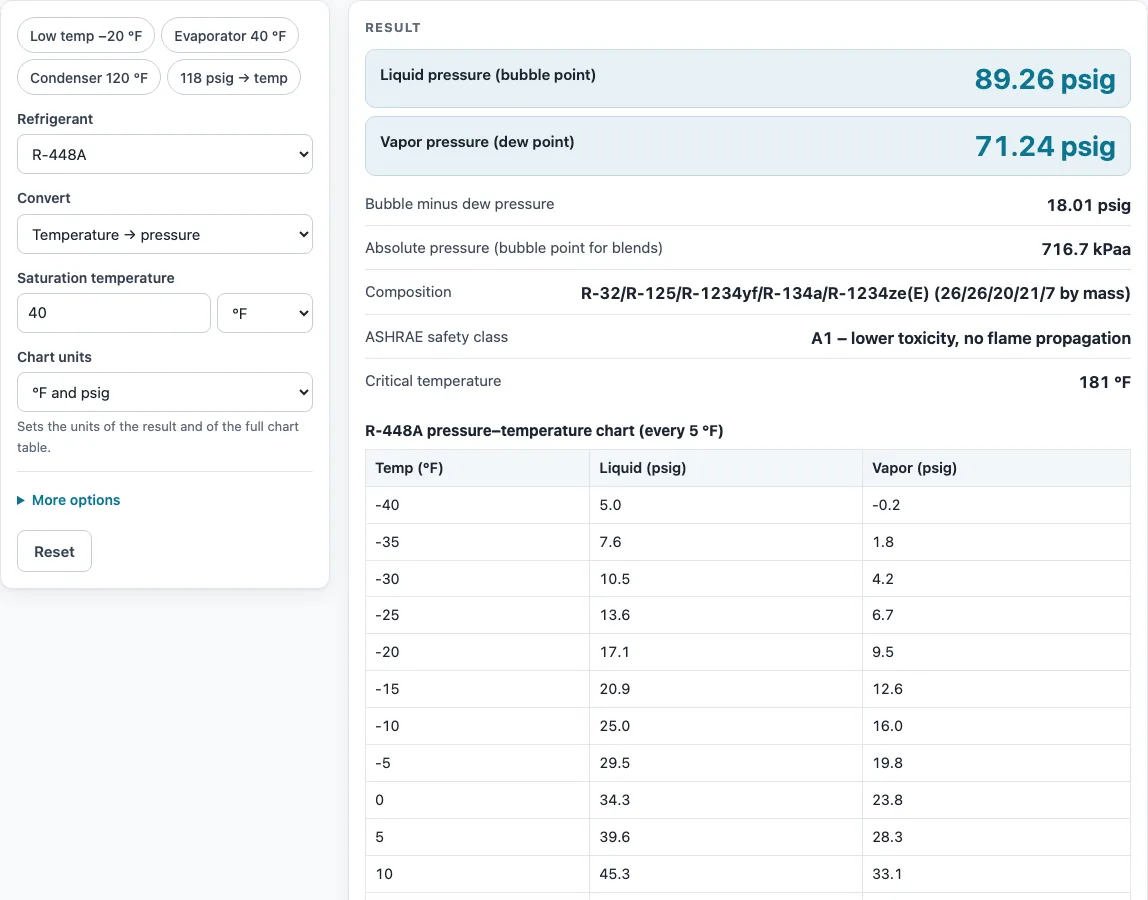
This R-448A PT chart (448A PT chart) lists the liquid and vapor saturation pressures of R-448A at every temperature. The R-448A PT chart calculator gives the pressure at which R-448A boils or condenses at a given temperature, and the temperature at a given pressure. Enter a value and it returns the liquid (bubble point) and vapor (dew point) results for R-448A, a blend used in supermarket and commercial refrigeration as a lower-GWP replacement for R-404A and R-22. It works as an R 448a pt chart or pt chart 448a lookup, and the full table appears under the result. The calculator runs in your browser, is free, and needs no sign-up.
Results print with the date for service records.
How to use the R-448A PT chart calculator
- Set Refrigerant to R-448A. The chart values change to match this blend.
- Set Convert to Temperature → pressure to find the pressure at a temperature, or Pressure → temperature to find the temperature at a pressure.
- Enter the Saturation temperature if it is shown in your chosen mode.
- Set Gauge or absolute pressure if it is shown. Pick psig for a gauge reading, or psia for an absolute reading.
- Set Chart units to °F and psig, or to one of the metric options.
- Open More options if you need them. Use Chart table step to change the spacing of the table rows (Auto, every 1, 2, 5 or 10 degrees). Enter an Altitude above sea level only if you are not at sea level.
- Read the result rows that apply to your mode. For R-448A you will see the liquid pressure (bubble point) and the vapor pressure (dew point). Read any warning shown below the result before you use the number.
Under the result, Copy result copies the result lines with a link, and Copy link copies the page address, which stores every input so the same calculation reopens later. Print / save as PDF prints the inputs, results, steps and date. Reset restores the starting example.
How do you read a PT chart?
A PT chart lists, for each temperature, the pressure at which a refrigerant boils or condenses at that temperature. This is called the saturation pressure. Find the temperature row, then read across to the pressure column that matches your reading.
For R-448A, the chart has two pressure columns because the blend has a temperature glide of roughly 8–10 °F. At 40 °F the liquid column reads 89.3 psig and the vapor column reads 71.2 psig. Use the liquid column for condenser and subcooling readings, and the vapor column for evaporator and superheat readings.
The chart temperature is the real refrigerant temperature only where liquid and vapor are both present, such as in the evaporator or condenser. In a superheated suction line or a subcooled liquid line the pressure is still about the evaporator or condenser pressure, but the pipe temperature is not the chart temperature: the difference between the two is the superheat or the subcooling.
What is the difference between bubble point and dew point?
The bubble point is the condition where the liquid is saturated and the first vapor bubble forms. The dew point is the condition where the vapor is saturated and the first drop of liquid forms. For a pure refrigerant these two values are the same, but for a blend with glide they differ.
At 70 °F, R-448A has a bubble point of 153.8 psig and a dew point of 129.1 psig, a difference of 24.7 psi. The difference is the reason the chart lists both. The liquid (bubble) value applies to liquid-side readings, and the vapor (dew) value applies to vapor-side readings. Because the blend has glide, the two values also mean that the temperature of the liquid and vapor at the same pressure is not the same, so always match the column to the part of the system you are measuring.
Sources
Data and methods used by this calculator (checked October 2026):
- CoolProp equations of state (saturation data)
- NIST Chemistry WebBook, thermophysical properties of fluids (pure refrigerants, checked within 0.05 %)
- ASHRAE Standard 34 refrigerant designations and safety classes
Worked examples
| Input | Result |
|---|---|
| R-448A, -20 °F | liquid 17.09 psig, vapor 9.533 psig |
| R-448A, 0 °F | liquid 34.33 psig, vapor 23.84 psig |
| R-448A, 100 °F | liquid 244.1 psig, vapor 212.6 psig |
| R-448A, 15 psig | liquid -22.96 °F, vapor -11.49 °F |
Calculated by the tool above with these values.
Frequently asked questions
What is the pressure of R-448A at 70 °F (standing pressure)?
At 70 °F the chart gives 153.8 psig for the liquid (bubble point) and 129.1 psig for the vapor (dew point). A system at rest with liquid in it reads close to the liquid value of 153.8 psig. Compare your reading with the matching column, and allow for a difference of 1–2 psi if your equipment manufacturer’s chart differs slightly.
What should R-448A pressures be when running?
The chart cannot give one running pressure, because running pressure depends on the evaporator and condenser temperatures. As examples, a 40 °F evaporator corresponds to a vapor pressure of 71.2 psig, and a 120 °F condenser corresponds to a liquid pressure of 321.3 psig. Check your readings against the chart at the temperatures you measure, and follow the equipment manufacturer’s charging and operating instructions.
Is a PT chart in psig or psia?
This chart is in psig, which is gauge pressure relative to the atmosphere. To convert to psia, add 14.696 psi at sea level. For example, 153.8 psig is 168.5 psia. Make sure your gauge and your chart use the same unit before you compare them.
Why does my R-448A chart differ from the manufacturer’s chart?
The values here come from equations of state and can differ from a manufacturer’s chart by 1–2 psi for blends. If the equipment manufacturer provides a chart or charging instructions, use those for the final setting.
What temperature corresponds to 15 psig of R-448A?
At 15 psig, the liquid (bubble point) temperature is −22.96 °F and the vapor (dew point) temperature is −11.49 °F. The gap between these two temperatures is the glide of the blend, so select the column that matches the part of the system you are checking.
What does a negative gauge reading mean on the chart?
A negative psig value means the pressure is below atmospheric, so the gauge reads vacuum. The calculator shows a warning when this happens, and the value is still a valid saturation pressure for that temperature.
Related tools
- All refrigerant PT charts: Use this when you need to compare several refrigerants side by side.
- Superheat and subcooling calculator: Use this after you have a PT reading and need superheat or subcooling from it.
- R-410A PT chart: Use this when your system runs R-410A instead of R-448A.
- R-22 PT chart: Use this for older systems that run R-22, which R-448A is a replacement for.
- R-32 PT chart: Use this when your system uses R-32.
- R-454B PT chart: Use this when your system uses R-454B.
- R-134a PT chart: Use this for systems that run R-134a.
- All HVAC calculators: Use this to find other calculators for sizing, load and system checks.