R404A PT Chart (R-404A Pressure Temperature)
Look up the R-404A saturation pressure for a temperature, or the temperature for a gauge reading, and print the full chart.
This R404A PT chart (an R404A or 404A pressure temp chart) lists the liquid and vapor saturation pressures of R-404A at every temperature. Need a PT chart for R-404A? This tool gives the saturation pressure of R-404A at any temperature you enter, or the saturation temperature at any pressure you enter. It shows the liquid (bubble point) and vapor (dew point) values side by side and can build a full pressure-temperature table. R-404A is often written R404 or 404A, and you can select it from the refrigerant list. Technicians use it to compare gauge readings with coil temperatures during service calls. The tool runs in your browser, is free, and needs no sign-up. Nothing you enter is uploaded.
Results print with the date for service records.
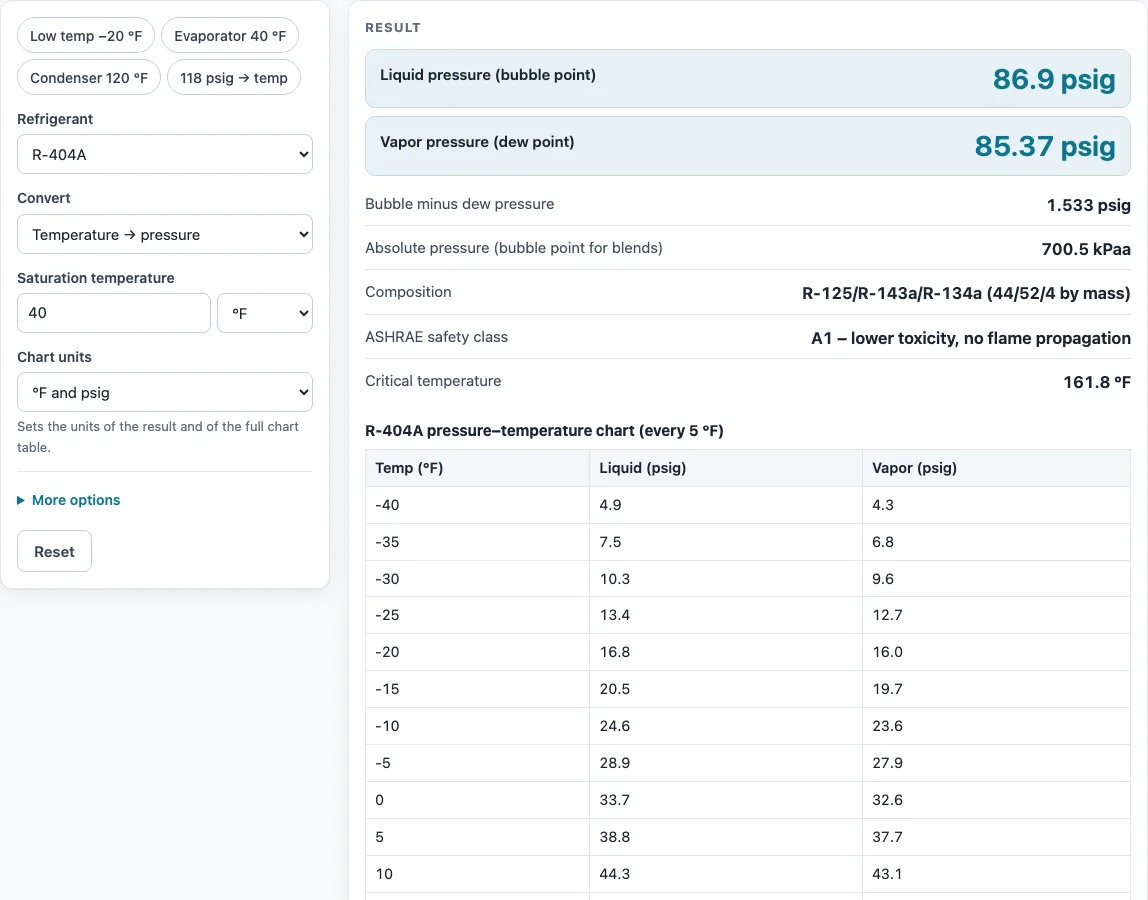
How to use the R-404A PT chart tool
- Open the Refrigerant drop-down and confirm that R-404A is selected.
- Open the Convert drop-down. Choose Temperature → pressure to find the pressure at a known temperature, or Pressure → temperature to find the temperature for a gauge reading.
- If the Saturation temperature field appears, type the temperature. If the Gauge or absolute pressure field appears, choose psig, kPag or barg for a gauge reading, or psia, kPaa or bara for an absolute reading.
- Choose your Chart units: °F and psig, °C and bar (gauge), or °C and kPa (gauge). This sets the units for the result and the full chart table.
- Open More options. Set Chart table step to Auto, every 1, 2, 5 or 10 degrees. If you work at altitude, enter your Altitude above sea level. Leave it blank at sea level.
- Read the result rows. Use the liquid (bubble point) pressure for condenser and subcooling readings, and the vapor (dew point) pressure for evaporator and superheat readings.
- Open How it was calculated to see the formula and each step with your numbers.
To try the tool quickly, click one of the example buttons above the form, such as R-404A at −20 °F. Copy result copies the result lines with a link, and Copy link saves every input in the page address so you can reopen the same calculation later. Print / save as PDF prints the inputs, results, steps and date. Reset restores the starting example.
How do you read a PT chart?
A PT chart lists the saturation pressure of a refrigerant at each temperature. Find the temperature in the table, then read across to the pressure for the same row.
Saturation pressure is the pressure at which the refrigerant boils or condenses at that temperature. Liquid and vapor exist together only at that pressure. In a superheated suction line or a subcooled liquid line the pressure is still about the evaporator or condenser pressure, but the pipe temperature is not the chart temperature: the difference between the two is the superheat or the subcooling.
Gauge readings are usually in psig. Psig is gauge pressure, measured relative to the atmosphere. Psia is absolute pressure, and at sea level psia = psig + 14.696. This chart uses gauge pressure at sea level, so 70 °F shows 149.3 psig for the liquid column and 147.4 psig for the vapor column.
What is the difference between bubble point and dew point?
The bubble point is the condition where a blend first begins to boil when it is warmed as a liquid. The dew point is the condition where a blend first begins to condense when it is cooled as a vapor.
R-404A is a zeotropic blend, so its components boil at different temperatures. Between the bubble point and the dew point, the mixture is partly liquid and partly vapor, and its composition shifts as it changes phase. R-404A has a very small glide, under about 1.5 °F, so the bubble and dew columns sit close together. The calculator shows a bubble minus dew pressure row so you can see how far apart they are.
For the same temperature, the liquid column is the bubble point and the vapor column is the dew point. Because the two values are close for R-404A, the choice matters less than it does for blends with larger glide, but it still matters for accurate readings. Use the liquid column for condenser and subcooling readings, and the vapor column for evaporator and superheat readings.
Sources
Data and methods used by this calculator (checked October 2026):
- CoolProp equations of state (saturation data)
- NIST Chemistry WebBook, thermophysical properties of fluids (pure refrigerants, checked within 0.05 %)
- ASHRAE Standard 34 refrigerant designations and safety classes
Worked examples
| Input | Result |
|---|---|
| R-404A, -20 °F | liquid 16.83 psig, vapor 16.01 psig |
| R-404A, 20 °F | liquid 56.59 psig, vapor 55.3 psig |
| R-404A, 100 °F | liquid 236.8 psig, vapor 234.7 psig |
| R-404A, 20 psig | liquid -15.7 °F, vapor -14.55 °F |
Calculated by the tool above with these values.
Frequently asked questions
What is the pressure of R-404A at 70 °F (standing pressure)?
At 70 °F on this chart, R-404A is 149.3 psig on the liquid (bubble point) column and 147.4 psig on the vapor (dew point) column. Standing pressure is read when the system is off and the refrigerant has settled to room temperature.
What should R-404A pressures be when running?
There is no single running pressure for R-404A, because it depends on the coil temperature and operating conditions. Find the saturation pressure at the measured evaporator or condenser temperature, then compare it with the gauge reading. Use the equipment manufacturer’s charging instructions when they are available.
Is a PT chart in psig or psia?
This chart is in psig, which is gauge pressure. To convert to psia at sea level, add 14.696. At altitude, the atmospheric pressure is lower, so enter your altitude under More options.
What is the R-404A pressure at 20 psig?
At 20 psig, R-404A has a liquid (bubble point) temperature of about −15.7 °F and a vapor (dew point) temperature of about −14.55 °F. Those are the values the calculator produces for this input.
Is R-404A still used?
Yes, R-404A is used in low- and medium-temperature commercial refrigeration, including freezers, walk-in coolers and ice machines. Because its global warming potential is very high, it is being replaced by blends such as R-448A.
How accurate is this chart?
The values come from CoolProp equations of state, checked against NIST data for pure fluids. Blend values can differ from a manufacturer’s chart by 1–2 psi, so use the manufacturer’s data when it is available. The result is for estimation only, so verify critical designs against the applicable standard.
Related tools
- All refrigerant PT charts: Use it to compare pressure-temperature data for several refrigerants side by side.
- Superheat and subcooling calculator: Use it when you need superheat or subcooling from pressure and temperature readings.
- R-410A PT chart: Use it when the system you are servicing runs on R-410A.
- R-22 PT chart: Use it for older equipment that still uses R-22.
- R-32 PT chart: Use it for systems that use R-32.
- R-454B PT chart: Use it for systems that use R-454B.
- R-134a PT chart: Use it for systems that use R-134a.
- All HVAC calculators: Use it to find other calculators for heating, cooling and refrigeration work.