R290 PT Chart (R-290 Propane Pressure Temperature)
Look up the R-290 saturation pressure for a temperature, or the temperature for a gauge reading, and print the full chart.
This R290 PT chart lists the saturation pressure of R-290 (propane) at every temperature, with a lookup in both directions. This is a free R-290 PT chart calculator. It converts between temperature and pressure for R-290 (propane), so you can find the saturation pressure at a given temperature, or the saturation temperature at a given pressure, and see a full pressure-temperature chart. It runs in your browser, with no sign-up, and nothing you enter is uploaded.
Use it for a pressure temperature chart R-290 check during a service call, a charging check, or a quote. R-290 is a single-component refrigerant, so each temperature has exactly one pressure. Where the chart is used for real equipment, the manufacturer’s chart and charging instructions take priority.
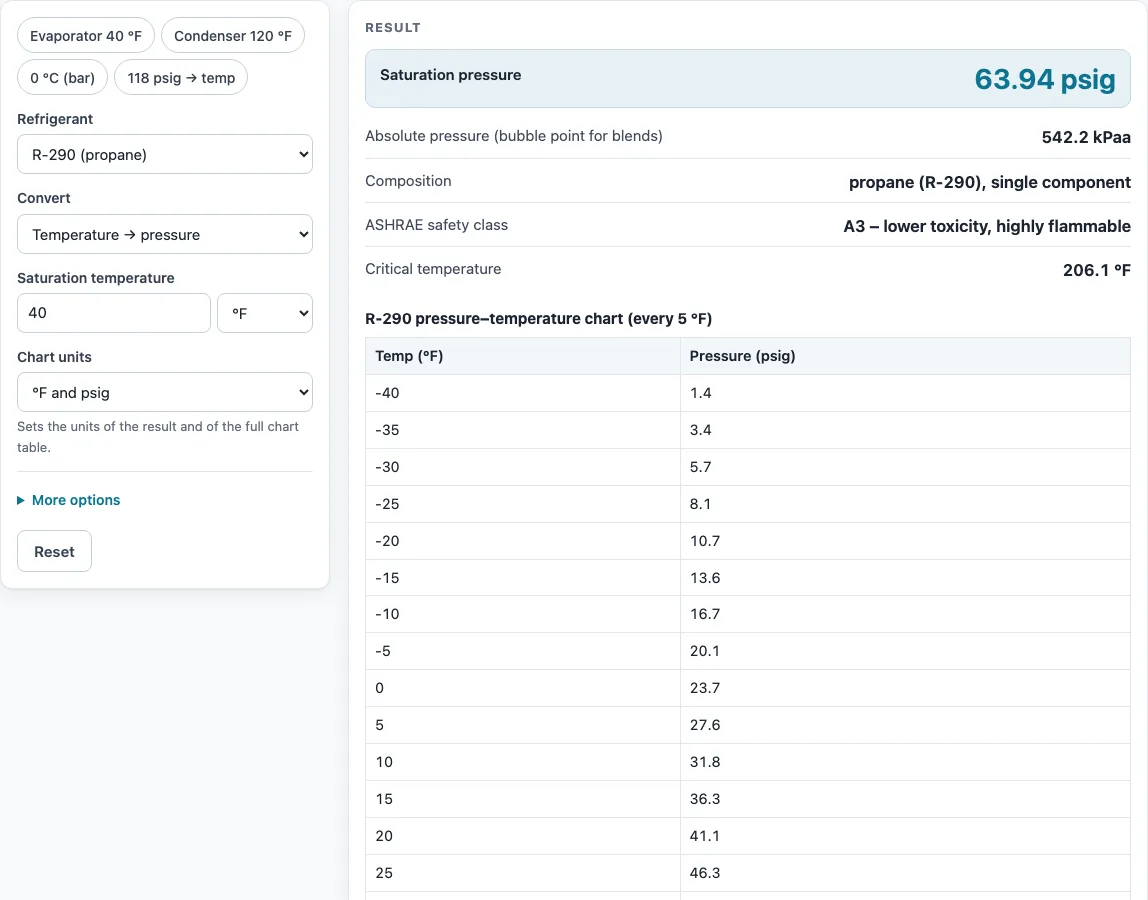
How to use the R-290 PT chart calculator
- Open the Refrigerant drop-down and choose R-290 (propane).
- Open the Convert drop-down. Choose Temperature → pressure if you know the temperature, or Pressure → temperature if you have a gauge reading.
- Enter your value in the input that appears. Depending on the mode, this is Saturation temperature or the pressure field.
- If the Gauge or absolute pressure input appears, pick psig, kPag or barg for a gauge reading, or psia, kPaa or bara for an absolute reading.
- Open the Chart units drop-down and choose °F and psig, °C and bar (gauge), or °C and kPa (gauge). This sets the units of the result and of the chart table.
- Read the result rows. Only the rows that apply to your mode are shown.
- Open More options if you need to change the Chart table step (Auto, every 1, 2, 5 or 10 degrees) or enter an Altitude above sea level. Leave altitude blank at sea level.
- Scroll to the chart table under the result to see the full R-290 pressure-temperature chart.
The example buttons above the form load common cases, such as R-290 at a given temperature. Reset restores the starting example.
To keep your work, use Copy link, which stores every input in the page address, or Print / save as PDF, which includes inputs, results, steps and the date. Copy result copies the result lines with a link.
How do you read a PT chart?
A PT chart lists the saturation pressure of a refrigerant at each temperature. Saturation pressure is the pressure at which the refrigerant boils or condenses at that temperature. To read it, find the temperature in the left column and read the pressure in the matching column, using the units you selected.
The chart temperature is the real refrigerant temperature only where liquid and vapor are both present, such as in the evaporator or condenser. In a superheated suction line or a subcooled liquid line the pressure is still about the evaporator or condenser pressure, but the pipe temperature is not the chart temperature: the difference between the two is the superheat or the subcooling. R-290 is a single-component refrigerant, so it has one pressure for each temperature and does not need the bubble and dew columns used for blends.
What is the pressure of R-290 at 70 °F (standing pressure)?
At 70 °F, R-290 has a saturation pressure of 110.2 psig at sea level. This is a gauge reading, so it is measured relative to the surrounding air.
In absolute terms, 110.2 psig plus 14.696 psi gives about 124.9 psia. Altitude changes the gauge reading because the local air pressure is lower, which is why the calculator has an altitude input.
How the R-290 values are calculated
The chart is not typed in from a printed table. It comes from the published equation of state for R-290, evaluated at every whole degree Celsius, and the calculator interpolates between those points (pressure is close to a straight line on a log scale against 1/temperature, so the error is far below gauge resolution). Checked against NIST data, the values agree within 0.01 %. A few points from the chart at sea level: -20 °F: 10.7 psig; 0 °F: 23.7 psig; 20 °F: 41.1 psig; 40 °F: 63.9 psig; 70 °F: 110.2 psig; 100 °F: 173.9 psig; 120 °F: 227.8 psig.. Set your altitude under More options and the gauge values shift by the difference in atmospheric pressure.
Sources
Data and methods used by this calculator (checked October 2026):
- CoolProp equations of state (saturation data)
- NIST Chemistry WebBook, thermophysical properties of fluids (pure refrigerants, checked within 0.05 %)
- ASHRAE Standard 34 refrigerant designations and safety classes
Worked examples
| Input | Result |
|---|---|
| R-290, -10 °C | 2.44 barg |
| R-290, 40 °C | 12.68 barg |
| R-290, 0 °C | 373.1 kPag |
| R-290, 5 barg | 8.001 °C |
Calculated by the tool above with these values.
Frequently asked questions
Is a PT chart in psig or psia?
Most service PT charts, including the values on this page, are in psig, which is gauge pressure relative to the atmosphere. Psia is absolute pressure, and equals psig plus 14.696 at sea level. Choose the unit that matches your gauges.
What should R-290 pressures be when running?
Running pressures depend on the evaporator and condenser temperatures. Read the saturation pressure at each of those temperatures from the chart, for example 63.9 psig at 40 °F or 227.8 psig at 120 °F, and compare those values with your gauges. Use the equipment manufacturer’s charging data where it is available.
Is R-290 flammable?
Yes. R-290 is propane, rated A3 (highly flammable) under ASHRAE safety class. Work on R-290 equipment requires procedures and tools designed for flammable refrigerants, and you should follow the equipment’s charge limits and the applicable safety standard.
Why doesn’t my gauge match the chart?
The chart temperature is the real refrigerant temperature only where liquid and vapor are both present, such as in the evaporator or condenser. In a superheated suction line or a subcooled liquid line the pressure is still about the evaporator or condenser pressure, but the pipe temperature is not the chart temperature: the difference between the two is the superheat or the subcooling. Compare the pipe temperature with the chart temperature for the gauge pressure.
What is the critical temperature of R-290?
The critical temperature of R-290 is about 206 °F (96.7 °C). Above this temperature, R-290 cannot be liquefied by pressure alone, so saturation pressure values stop applying.
How do I convert -10 °C to barg for R-290?
Set Convert to Temperature → pressure, choose R-290 (propane), enter -10 °C as the saturation temperature, and set the units to °C and bar (gauge). The result is 2.44 barg.
Related tools
- All refrigerant PT charts: Use this to find the PT chart for any refrigerant covered on the site.
- Superheat and subcooling calculator: Use this after reading a saturation pressure to work out superheat or subcooling.
- R-410A PT chart: Use this when the system uses R-410A instead of R-290.
- R-22 PT chart: Use this for older systems that still use R-22.
- R-32 PT chart: Use this for systems that use R-32.
- R-454B PT chart: Use this for systems that use R-454B.
- R-134a PT chart: Use this for systems that use R-134a.
- All HVAC calculators: Use this to browse the other calculators on the site.